
Why and How the Structure Failed
On March 15, 2018, a pedestrian concrete truss bridge in Miami, FL, collapsed during construction. The span that collapsed had been designed as a concrete truss bridge with prestressed members. Figure 1 shows the bridge site before and after the collapse of the main span. The collapse caused multiple fatalities and raised serious concerns regarding the design and construction of the bridge, including the emerging concept of Accelerated Bridge Construction (ABC). ABC usually involves innovative planning, design, and construction methods to reduce the onsite construction time that occurs when building new bridges or replacing existing bridges. In this project, the main span of the bridge was constructed offsite, then transported and placed onto its piers overnight. The bridge collapsed five days later with the roadway underneath it open to traffic. According to the preliminary report from NTSB, workers were re-tensioning tendons in diagonal member 11 (Figure 1) at the time when the bridge collapsed.

Figure 1. Main span of the bridge: a) before collapse; b) after collapse. Courtesy of NTSB.
The National Transportation Safety Board (NTSB) investigated the collapse and released photographs that showed that the bridge exhibited significant signs of distress before the collapse. Most prominent were cracks in the joint area between diagonal member 11, vertical member 12, and the deck. Forensic material testing showed no significant issues in material strength or quality. An investigation of the bridge deck at the north end showed that reinforcement bars were correctly placed. The NTSB’s final report judged the design of the concrete joint at the north end (between members 11, 12, and the deck) to be flawed and attributed the failure to it. The NTSB investigation also noted that peer-review of the bridge design was rushed, underfunded, and, therefore, more likely inaccurate and incapable of detecting critical design errors.
Although the NTSB investigation identified the north end joint as the cause for failure, the report was not clear on the specific sequence of processes that led to failure. In this article, a high fidelity computational model was used to develop a forensic understanding of the collapse process. A simulation model of the bridge was created based on the as-built drawings and run on the LS-DYNA platform. The different construction stages were simulated using the model, and parametric studies were carried out to investigate how various influential parameters could have influenced the collapse resistance of the bridge.
Computational Modeling
The computational model was constructed using the finite element method, wherein the structure and its components were discretized into a multitude of small elements, each with specific properties associated with its parent material. For example, steel bar elements could yield and fracture, while concrete elements could crush, crack, and exhibit confinement and tension stiffening effects. Tension stiffening is the beneficial effect of reinforcement on the mechanical behavior of surrounding concrete. Prestressing was explicitly accounted for through the introduction of prestressing tendon finite elements. The model was designed to represent member separation and falling of debris to represent the failure process faithfully. Figure 2 shows a schematic of the computational model of the main span of the bridge.
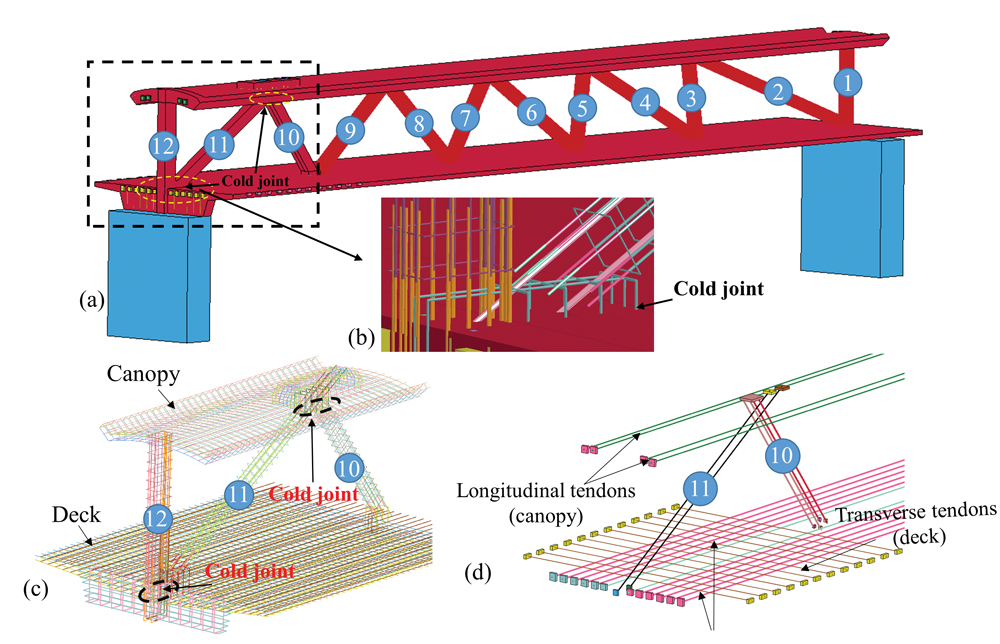
Figure 2. Simulation setup of the bridge: a) overall computer model of the bridge; b) close-up of reinforcement at the joint; c) steel rebars detailing; d) prestressing tendons detailing.
Numerical Simulation Results
Before the bridge collapsed, the main span went through four construction stages: prestressing, transportation, relocation, and re-tensioning. The behavior of the structure under each of the stages was simulated using the computational model. The main findings from the simulations are as follows.
Prestressing Stage
The simulation results showed that, after releasing the prestressing force in the truss members and deck, localized concrete cracking occurred around the north end joint in accord with the documented damage. At the time, the observed cracks were deemed benign, and additional construction stages were allowed to proceed. These cracks were initial indicators of a serious design problem.
Transportation Stage
After assembly on the ground, the main span was transported on two self-propelled modular transporters (SPMTs) and placed onto the piers. The simulation model indicated that the north end joint of the bridge suffered additional minor damage in the concrete adjacent to the prestressing tendon anchor plates for member 11, which were embedded in the deck. This zone was highly stressed due to the confluence of prestressing tendon forces and other bridge member forces. The damage was internal and likely did not manifest as external cracks on the surface of the joint. The computed deflection at the northern end was small, less than 0.12 inches.
Relocation and Re-tensioning
Extensive cracking appeared around the joint at the north end of the bridge after the main span was placed on the piers. Figure 3 shows the concrete cracking observed in the real bridge and computed from the simulation model. There is a reasonable correlation between the observation and the simulation, providing confidence in the simulation model’s fidelity. The east side of the joint experienced severe cracking damage in the heel of member 11 (Figure 3a) due to excessive sliding along the cold joint between members 11 and 12 and the deck. Other cracks extended into the deck, creating a pattern consistent with punch-out failure distress associated with the excessive force demand imposed by diagonal member 11 onto the deck. The simulation model suggests that the bridge was on the verge of two different types of failure modes: sliding along the cold joint and punch-out failure in the deck region.

Figure 3. Cracks in the joint area of Member 11 after relocation: a) actual bridge, courtesy of NTSB; b) simulation.
After observing the cracked condition of the bridge at the north end joint, bridge engineers decided to re-tension diagonal member 11 in an attempt to close the cracks in the joint region. During this operation, the bridge collapsed. The simulation model suggests that collapse occurred due to sliding on the cold joint between members 11, 12, and the deck (Figure 4). In essence, the north end joint was pushed out, causing the bridge to fall off its support. Instead of remedying the cracking symptoms as intended, re-tensioning member 11 aggravated the situation and precipitated the progressive collapse process. Figures 5 and 6, show the collapse process, the final configuration of the actual bridge, and as-computed from the simulation model. The simulation results captured the collapse mode of the bridge reasonably well.
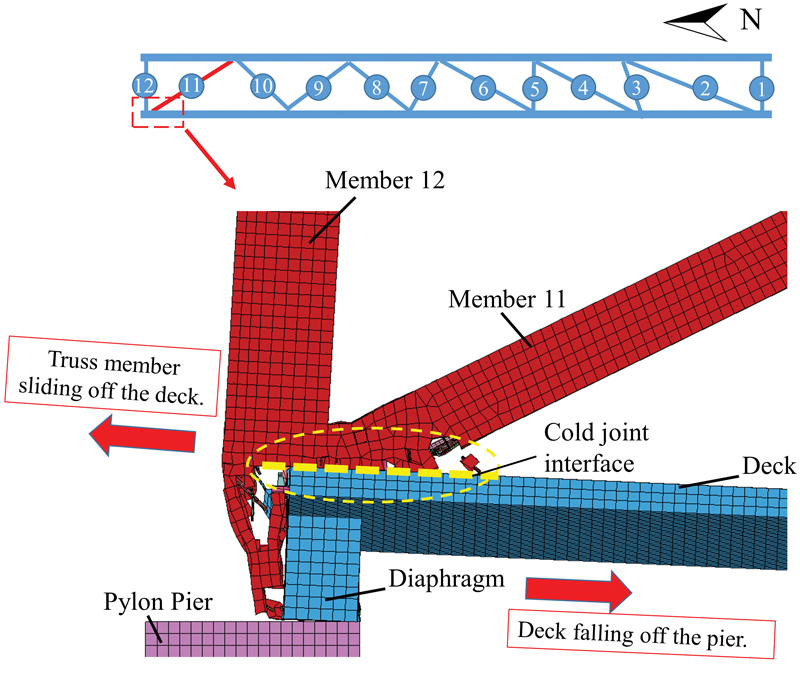
Figure 4. Sliding action triggered by re-tensioning member 11.
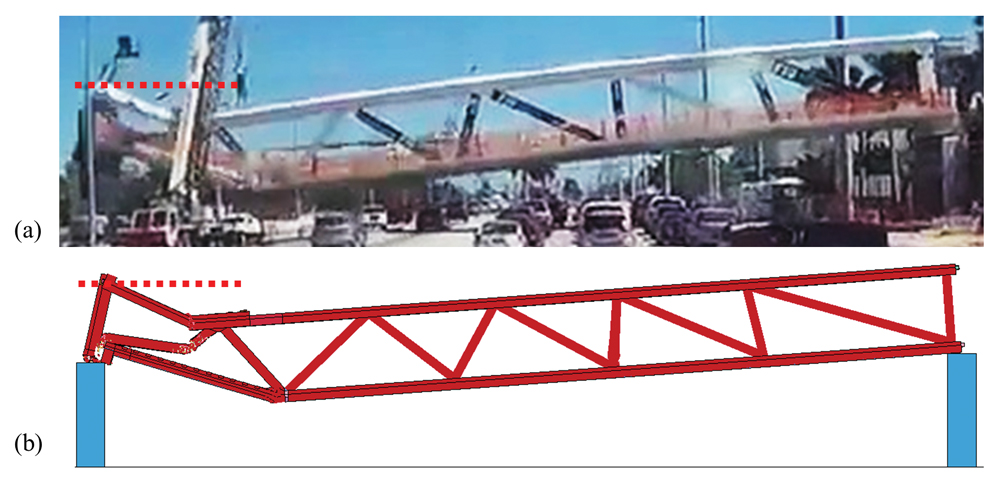
Figure 5. Failure mode of the bridge from a) accident video frame, courtesy of Instagram/@o2webdev; and b) computer simulation.

Figure 6. Close up of failure of member 11 during the collapse: a) simulation; b) accident photo. Courtesy of NTSB.
Parametric Studies
The simulations clearly showed that the cold-joint design and decision to re-tension were critical factors in the bridge collapse. Parametric studies were conducted using the simulation model to draw broader lessons from the accident to prevent future failures.
Coefficient of Friction
The coefficient of friction used in the simulation model was selected as 1.0 based on the as-designed condition of the joint. Since cold joint slip depended on this parameter, the coefficient of friction was increased to 1.4 to see if additional roughening of the cold joint surface could have prevented failure. A coefficient of friction of 1.4 corresponds to an extremely rough surface and represents an extreme value. The simulation showed that, even with this high number, a slip of the joint still occurred and resulted in bridge failure. These results indicate that relying on friction for the stability of the entire structure is risky. Shear keys or some other explicit shear resisting mechanism should have been employed and would have been more reliable and helpful in meeting the horizontal shear demand in the joint.
Re-tensioning
Different re-tensioning forces were applied to the tendons in member 11 to reach a stress level that ranged from 55% to 100% of the yield strength of the tendons to study the effect of re-tensioning. The simulation showed that increasing the prestress levels in member 11 led to more damage in the joint area, specifically more heel damage and widespread damage in the body of the joint itself. The simulation clearly showed that increasing the re-tensioning level caused the rate of joint slip to increase significantly. At 95% of the yield strength, the joint quickly slid off the deck. Failure was prevented when the joint was modeled as monolithic (i.e., there was no cold joint).
Even if member 11 had not been re-tensioned, the bridge would likely have failed as creep exacerbated sliding at the cold joint or punch-out failure. However, since the process would have been slow and entailed widening cracks that serve as a significant warning sign of structural distress, action could have been taken to address the situation. Overall, the simulation results suggest that re-tensioning member 11 should not have been considered as an appropriate solution to reduce the cracking symptoms observed in the cold joint area since it aggravated the sliding of the joint and damaged the integrity of the structure in a catastrophic manner.
Conclusions and Lessons Learned
The simulation results showed that cracking damage was initiated as soon as prestressing was applied to the concrete members. After placing the bridge on its supports, severe punch-out cracking patterns developed around the northern joint. The computed damage locations coincided reasonably well with the documented pre-failure crack locations around the cold-joint. The simulation results also suggested that the damaged cold joint at the north end experienced sliding behavior under the re-tensioning forces applied to diagonal member 11, which precipitated the collapse of the bridge. Based on the detailed analysis and simulations, the authors believe that several lessons can be drawn from this accident:
- A concrete truss with prestressed members supported the collapsed bridge deck. The use of a concrete truss for aesthetic reasons unnecessarily introduced complications related to prestressing and cold joints in the bridge, both of which likely played critical roles in the collapse of the bridge.
- Relying on friction at a critical joint (between members 11, 12, and the deck) is risky in a non-redundant system like that used in the bridge. Friction is unreliable by nature and can lead to sudden failure when the demand exceeds capacity. Shear keys or some other explicit shear resisting mechanism placed in the cold joints would have been more reliable and helpful in meeting the horizontal shear demand in the joint.
- Re-tensioning diagonal truss members should not have been considered as an appropriate solution to remedy the cracks in the cold joint area since it promoted more sliding across the cold-joint, making the bridge more vulnerable to collapse. Cracks in the cold joint area should be viewed as a meaningful warning sign of impending collapse, and immediate action should be taken to ensure the stability of the structure after detailed calculations or modeling.
- The collapse of the bridge does not necessarily imply that accelerated bridge construction is risky. Certainly, it shows the need for adequate analysis simulating construction aspects, such as the presence of cold joints or utility conduits, to ensure the safety of the bridge during and after the construction. Peer review should necessarily be concerned with assessing the impact of such details.
- The bridge was kept open while it was under construction (member 11 was being re-tensioned), probably to showcase the accelerated construction aspect of the project. This accident reemphasizes the lesson that public safety should never be compromised simply to showcase the application of a new construction technology, even though the technology itself may have been shown to be safe in prior applications. Any construction area is, by nature, hazardous to the public.■
References
Cao, R., El-Tawil, S., Agrawal, A.K., (2020). “Miami Pedestrian Bridge Collapse: A Computational Forensic Analysis” Journal of Bridge Engineering, ASCE. DOI: 10.1061/(ASCE)BE.1943-5592.0001532
NTSB (2018a). “Preliminary Report: Collapse of Pedestrian Bridge Under Construction Miami, Florida.” www.ntsb.gov/investigations/AccidentReports/Reports/HWY18MH009-prelim.pdf
NTSB (2018b). “Investigative Update1 (August 09, 2018): Collapse of Pedestrian Bridge Under Construction Miami, Florida”. www.ntsb.gov/investigations/AccidentReports/Reports/HWY18MH009-investigative-update.pdf
NTSB (2018c). “Investigative Update2 (November 15, 2018): Collapse of Pedestrian Bridge Under Construction Miami, Florida”. www.ntsb.gov/investigations/AccidentReports/Reports/HWY18MH009-investigative-update2.pdf
NTSB (2019). “Pedestrian Bridge Collapse Over SW 8th Street Miami, Florida March 15, 2018”. Highway Accident Report, NTSB/HAR-19/02.